The Resilience Newsletter
Retail & Consumer Goods · Evaluation
Proving It Before Peak
Before you trust an autonomous operations platform with Black Friday, make it earn that trust on an estate whose failures you already know the answers to. Twelve services, eight staged faults, and a week.
Issue 05 argued that retail's characteristic outage is not a novel fault but a configuration chosen years ago against traffic that no longer exists. That diagnosis is only useful if you can act on it. This issue is about the instrument — a working retail estate that fails on purpose, and what it lets you measure before you commit to anything.
01 — The ProblemThe evaluation you cannot run in production
Every reliability product demonstrates well. The demo estate is clean, the incident is scripted, and the tool finds the cause because the cause was planted for it. None of that tells you what the product does against your estate on a Tuesday in November.
The honest test is a real incident. But a real incident is the worst possible moment to run a bake-off: the people who would evaluate the tool are the people restoring service, and nobody is taking notes. So the evaluation gets deferred, and the decision gets made on a slide deck.
You cannot grade a diagnosis unless someone already knows the answer. In production, nobody does — that is what an incident is.
02 — The InstrumentAn estate that fails on purpose
The Retail Playground is a deliberately realistic retail IT estate: twelve applications across five languages, real Postgres with a streaming replica, a real search index, a real message bus, simulated stores and payment processors. Eight tier 0 services carry checkout; four tier 1 services carry fulfilment and back office. It is the shape of estate Walmart, Target or Amazon operate — smaller by orders of magnitude, identical in its failure modes.
What makes it an instrument rather than a demo is the scenario runner. It injects a named fault at a controlled time, waits for ThalamusTrace to open a problem and for Thalamus SRE to complete an investigation, and then scores both against what it knows to be true. The grader holds the answer key. The products do not.
| Scenario | The fault, and why retail recognises it |
|---|---|
| RT-S1 | A relevance flag turns every query into a broad synonym expansion. Request volume does not change; the work per request does. Harmless in staging, because staging has no traffic. |
| RT-S2 | The primary payment processor degrades. Failover is written for a processor that is down; this one is slow, so it never fires. |
| RT-S4 | A flash sale meets per-line reservation deadlocks. The traffic is the event everyone planned for; the deadlock is not. |
| RT-S5 | Full ERP snapshots hold the order-management read replica in a long read. Customers are told their order does not exist. |
| RT-S6 | A pricing release meets peak on the shared cache — one Redis holding promotion rules, availability and sessions. |
| RT-S8 | Staged checkout resilience meets a slow processor, and the retries produce duplicate charges. |
Three of those eight are release or configuration faults with no deploy and no error rate to alert on. That ratio is not an accident; it is the sector's actual distribution.
03 — Day OneWhat standing it up actually costs
Three components, each its own deployment: the estate, ThalamusTrace, and Thalamus SRE. They meet at four narrow seams and nothing else — telemetry out over OTLP, problems pushed to SRE over a signed webhook, live signals pulled back on demand, and remediation actions returned to a bounded executor. Everything is declared in compose files and environment variables.
On a developer laptop the first build takes twenty to thirty minutes, almost all of it compiling twelve service images; subsequent starts are minutes. One bootstrap command registers every service, SLO, topology edge and runbook with both products. Budget an afternoon, not a quarter.
The same four seams are how you point the products at your own estate. The collector that ships the playground's telemetry to ThalamusTrace is a stock OpenTelemetry collector with one endpoint changed. There is no agent to roll out to every host before you can see anything.
Day one does not give you a lower MTTR. It gives you two things you did not have: a measured baseline for how long each phase of your incident response actually takes, and the Resiliency Auditor's findings against your own repositories. Both are results. Neither requires an incident to obtain.
04 — The NumberTaking MTTR apart
MTTR as a single figure hides the thing you need. Decompose it and the question becomes answerable: detect, assemble, attribute, decide, act. ThalamusTrace compresses the first two — a problem opened on latency with flat traffic, with the dependency graph already resolved. Thalamus SRE compresses the next two. The playground times each segment separately, which is the only way to know which product earned which minute.
The executive view reports five figures, and they are the ones that survive contact with a board:
| Metric | What it answers |
|---|---|
| SLO adherence | Are we inside the commitments we made, per service and per tier — not annualised, which hides November entirely. |
| Open incidents | Current load on the organisation, not a trailing average. |
| MTTA | Time to acknowledge. Separates a detection problem from a routing problem. |
| MTTR | Time to restore. Only meaningful alongside MTTA and the phase split above. |
| Toil | Share of engineering time spent diagnosing and remediating by hand. The number that predicts attrition. |
05 — Before the IncidentThe auditor and the tuner
Reducing MTTR is the defensive half. The offensive half is having fewer incidents, and it is where the two remaining capabilities sit.
The Resiliency Auditor reads a repository rather than its telemetry. Four agents — an orchestrator, a scanner, an analyser and a ticket creator — walk the source for missing timeouts, unbounded retries, absent circuit breakers and unbulkheaded pools, return a resiliency score out of a hundred with both findings and strengths, and file the gaps as tickets. It runs against a codebase in a quiet quarter, which is exactly when Issue 05's configuration was set wrongly.
The Resiliency Tuner is the real-time counterpart: eight specialist agents reading live traffic through the observability connection, proposing specific values rather than advice. Each recommendation carries a current value, a recommended value, a flag of too loose, too tight or optimal, the evidence that justifies it, a confidence and a priority — and a decision field, because nothing applies itself. It can be scheduled hourly, daily, weekly or monthly, so a parameter set in 2019 does not stay set until it fails.
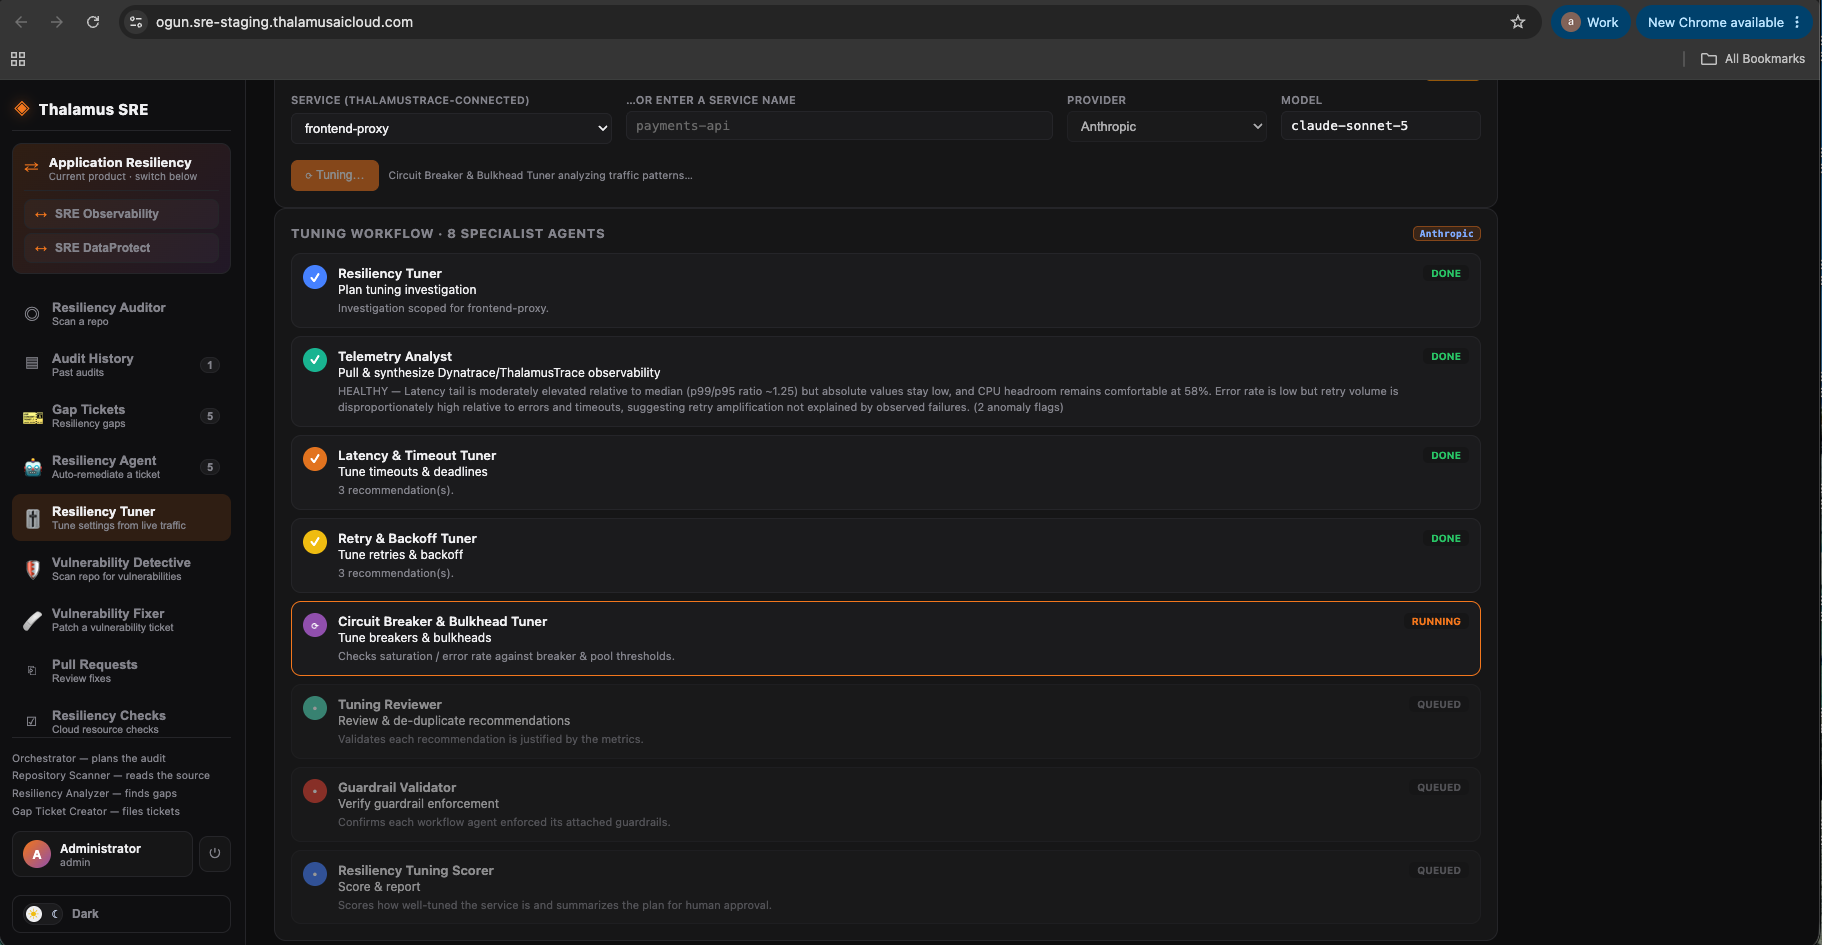
“Latency tail is moderately elevated relative to median (p99/p95 ratio ~1.25) but absolute values stay low, and CPU headroom remains comfortable at 58%. Error rate is low but retry volume is disproportionately high relative to errors and timeouts, suggesting retry amplification not explained by observed failures.”
That is a healthy service. Every dashboard would show it green. It is also the precise precondition for the self-inflicted outage described in Issue 05 — found on an ordinary afternoon, months before the traffic that would have converted it into one.
06 — What the Board SeesSpend, knowledge, postmortems
Three questions follow any autonomous-operations proposal. All three have a view.
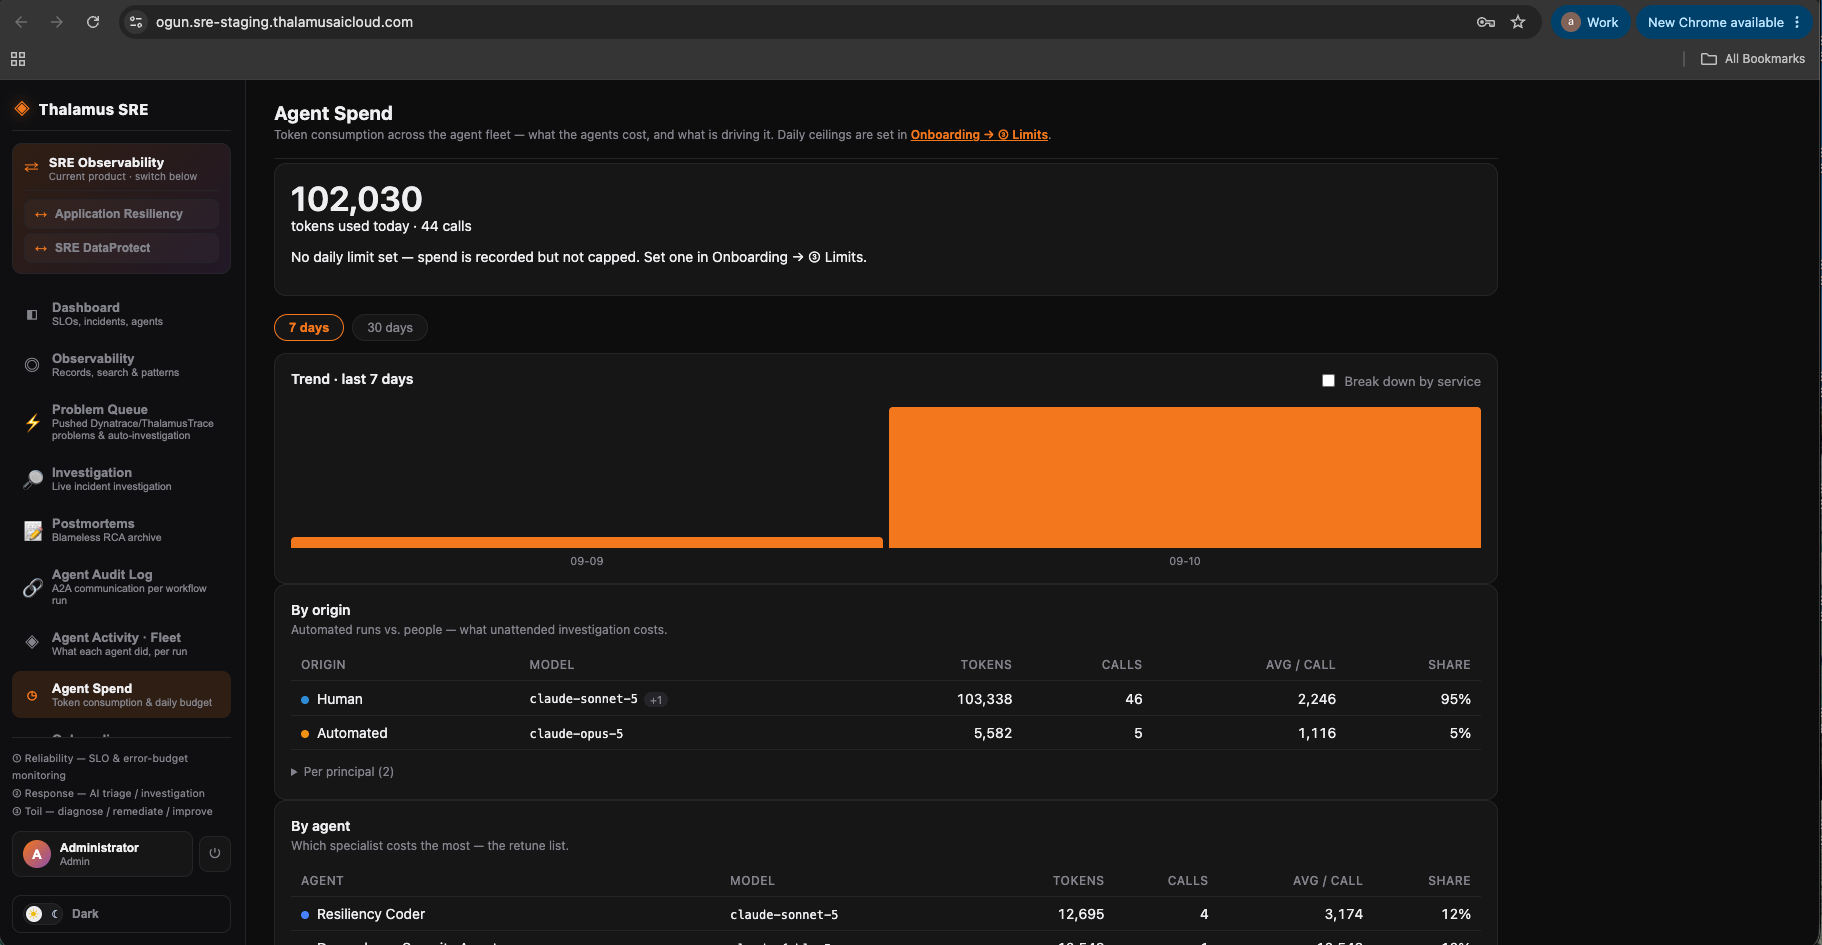
What does the automation cost? Token consumption is recorded server-side, in the database, not in a browser — because a daily ceiling that lives in local storage is advisory. Spend is broken down by origin, separating what people asked for from what ran unattended, and by specialist agent, which is the retune list. The ceiling stops new investigations from starting; it never kills one in flight, on the reasoning that a half-finished root-cause analysis during a live incident is worse than the tokens it saves.
Does the organisation get smarter? Each agent writes a reusable note at the end of its work — the pattern, the language, the service type, what worked and what to watch — filed under the repository it came from. The KnowledgeHub answers questions against that corpus with citations: how did we fix retry storms in Go services? It publishes to Confluence and flags when the published page has drifted from the source.
Do postmortems improve anything? They are drafted from the live investigation rather than reconstructed days later from memory, carrying the timeline, the root cause, the resolution and action items, and publish to Confluence as blameless RCA. The archive is what turns the eight scenarios from a one-off score into a trend.
The playground is not your estate. Its twelve services are not your four hundred, its eight faults are not the full space, and a product that scores well here can still struggle against something genuinely novel. What it does establish is a floor: a product that cannot attribute RT-S2 — a documented failover gap on timeouts, with the evidence present in the telemetry — will not do better on a harder problem in a larger estate under real pressure.
07 — Getting ThereFive days, and what each one proves
The evaluation, as a week
Day 1 — Stand up the playground and both products. Run the bootstrap. Record your current MTTA and MTTR from your last five incidents; that is the baseline everything else is measured against.
Day 2 — Run RT-S1 and RT-S2 in recommendation mode. Watch the phase split, not the total. The question is whether the investigation names the flag rather than recommending more capacity.
Day 3 — Point the Resiliency Auditor at two of your own repositories. The findings are yours to keep whatever you decide about the products.
Day 4 — Run the Tuner against a real service through your existing observability. Take the recommendations to the owning team and see how many they accept.
Day 5 — Run RT-S5 and RT-S6, the two that touch shared infrastructure. Read the generated postmortems. Ask whether you would have circulated them unedited.
At the end you have a measured baseline, a scored result against known faults, findings against your own code, and a spend figure for what all of it cost to run. That is a decision with evidence behind it.
Peak is on the calendar. It has been for a year. The only variable is how much you know about your estate before it arrives.